
Investing can feel overwhelming, especially if you’re just starting out. People tend to overcomplicate this, but setting up your Roth IRA retirement account and choosing investments doesn’t need to be a daunting task.
Before we dive into strategies, let’s talk about getting your mindset right. Think of it like learning to ride a bike. You don’t just jump on and expect to be a pro right away. You need to learn the basics, practice, and maybe even fall a few times. The same goes for investing.
So, how do we put that mindset into action when choosing investments for a retirement account like the Roth IRA? I’ll show you.
A Roth IRA is a powerful tool for building tax-free wealth for retirement, and with the right stock-picking strategies, you can maximize its potential.
This post will show you how to choose stocks or funds that align with your goals and help you make the most of your retirement account.
Now before we dive in strategies to consider to maximize your Roth IRA – let’s talk about some key principles to keep in mind.
Disclaimer: This content is for informational purposes only and is not financial advice—all decisions are your responsibility.
Table of Contents
Mind over Matter
Tip #1: Don’t Try to Time the Market
If you’re a perfectionist like I am, I suggest you do the best you can to stop that tendency when investing. You can’t predict the stock market, but you can make smart decisions to protect your investments.
We can’t buy stocks at the perfect moment. Trying to “time the market” is a fool’s errand. Nobody—and I mean nobody—can consistently predict what the market will do in the short term, it’s just too unpredictable.
Long-term investing is different; the goal is to let time work its magic because it’s a long-term game. It’s not about getting rich quick.
Think of it as planting a tree. You don’t plant a seed one day and expect a giant oak tree the next. It takes time, patience, and consistent care. The stock market has its ups and downs, but over the long haul, it has historically trended upwards.
Short-term predictions, however, are just guesses. Market dips (times when stock prices sell off) are actually buying opportunities—they’re a normal part of the market.
Think of a dip as a sale on your favorite items — you’re more likely to buy it when it’s cheaper. The same idea applies to stocks.
If you’re new I suggest instead of trying to time the market, focus on investing consistently over time. This is often called “dollar-cost averaging,” which we’ll talk about later.
Tip #2: Don’t Rely on Recommendations
Make your own informed decisions. Don’t just blindly follow recommendations. The most important part of investing is conviction—believing in what you’re investing in.
Your conviction is what will help you weather the storm during unpredictable moments because you believe in the future value of your favorite companies.
No one can give you that conviction by just telling you about a certain stock or index fund.
The goal is to empower you to identify potential opportunities and make well-informed investment decisions yourself.
Tip #3: Be Rational When Others Are Emotional
Investing is often said to be 90% psychology and 10% skill. While technically, investing is as simple as buying a diversified index fund, the emotional aspect makes it challenging for many.
When the market is volatile, it’s natural to feel worried and want to sell everything. But that’s often the worst thing you can do!
Sometimes, the best thing you can do as an investor is nothing at all—just let your investments grow over time.
The key is to use the knowledge you’ve learned to stay level-headed, identify great opportunities and avoid letting your emotions take over.
Tip #4: Start Small and Learn as You Go
A common misconception is that investing is only for people with large sums of disposable income. This isn’t true at all!
It’s about taking action, staying disciplined and starting early. You can start small, even with $200 a month, and gradually increase overtime.
Think about it, building wealth is really about buying your freedom—freedom of time, peace of mind, contentment, access to better healthcare, being able to afford healthier food, and a more comfortable lifestyle.
Consider what’s really important to you and your family.
One powerful way to start building that financial freedom, especially for retirement, is through a Roth IRA.
So, what exactly is a Roth IRA, and why is it so important? Let’s find out.
What is a Roth IRA?
A Roth IRA is a special type of retirement savings account where you contribute money you’ve already paid taxes on (post-tax dollars). This means when you withdraw the money in retirement—including any investment growth—you won’t owe any additional taxes.
It’s a great way to build long-term wealth, especially if you expect to be in a higher tax bracket in retirement.
Think of it like this:
Example: You contribute $250 to your Roth IRA each month. This adds up to $3,000 by the end of the year, all with “post-tax dollars” because taxes have already been withheld from your paycheck.
When you retire, you can withdraw the money you put in (your contributions) and any money you made from those investments (your profits) without paying any taxes.
The Roth IRA’s tax-free withdrawals make it a powerful tool for building wealth. It allows your investments to grow tax-free, giving you more control over your money.
How to Open a Roth IRA
This article provides a high-level overview of opening a Roth IRA. We’ll cover more specific details in future posts.
Check Your Eligibility: There are income limits for contributing to a Roth IRA. Make sure you meet the requirements for the current tax year. You can find the most up-to-date information on the IRS website or a simple Google search.
Choose a Brokerage: A brokerage is a company that allows you to buy and sell investments. Some popular choices include:
Open Your Account: Once you’ve chosen a brokerage, you can open your Roth IRA account online.
Fund Your Account: You’ll need to transfer money into your Roth IRA, either manually or automatically with each paycheck.
Next, let’s talk about how compound interest works and finding the right investing style for your goals and lifestyle.
The Power of Compound Interest
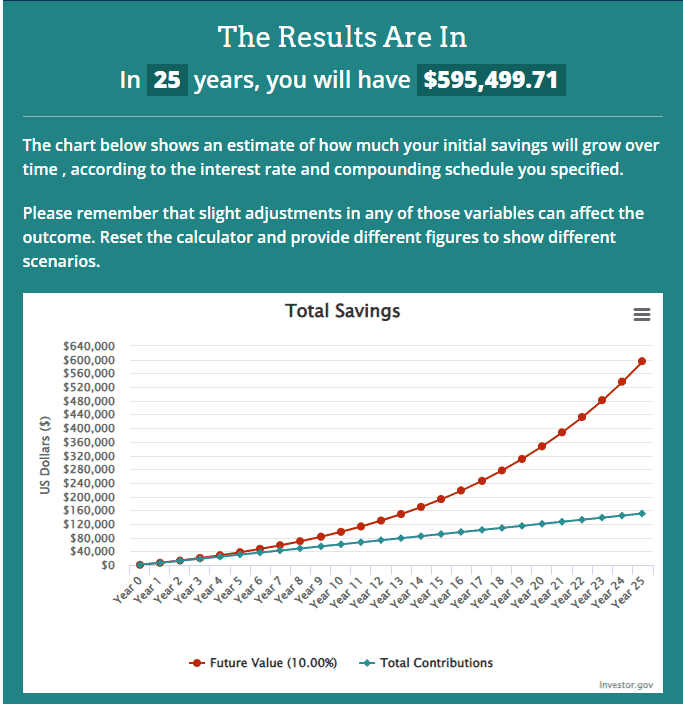
This is the fun part. Ever heard the saying, “Money makes money”? That’s the power of compound interest in action. It’s one of the most powerful tools for building wealth over time, and it’s surprisingly simple to understand.
Think of it like a snowball rolling down a hill. It starts small, but as it rolls, it gathers more snow, becoming bigger and bigger. Compound interest works similarly with your investments.
Instead of just earning interest on your initial investment, you also earn interest on the interest you’ve already earned.
This “interest on interest” effect causes your money to grow at an accelerating rate. It’s like a chain reaction of growth, and it’s what makes long-term investing so powerful.
Choosing Your Investing Style
Choosing the right investing style is about finding what works for you. Some people like to watch the market closely, while others prefer a hands-off approach.
The key is to choose a style that aligns with your personality, how much time you have, and your financial goals.
As a money coach, I’ve worked with many students but the two main types of investors are: those who prefer to keep things simple and automated, and those who like to actively manage their investments based on market news and trends.
Two methods to consider:
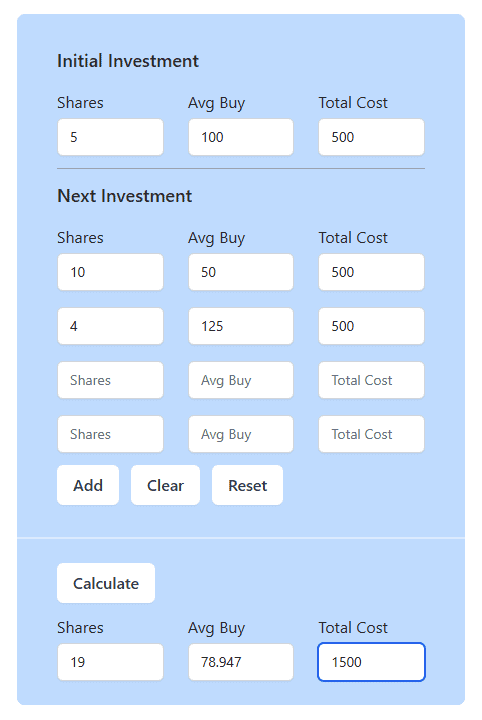
1. Dollar-Cost Averaging (DCA) – The Simple Way:
This is great if you want to automate your investing. You invest a set amount regularly (say $500 every month), no matter what the price of the asset is at the time you’re buying.
Example:
Let’s say you want to invest in a stock that currently trades at $100 per share. You decide to invest $500 per month using DCA.
- Month 1: The stock price is $100. You buy 5 shares ($500 / $100 = 5 shares).
- Month 2: The stock price drops to $50. You buy 10 shares ($500 / $50 = 10 shares).
- Month 3: The stock price rises to $125. You buy 4 shares ($500 / $125 = 4 shares).
Over these three months, you invested a total of $1,500 and acquired 19 shares. Your average cost per share is $78.95 ($1,500 / 19 shares).
Notice that even though the stock price fluctuated, your average cost is lower than the initial price of $100.
2. Buying During Market Dips – The Active Approach:
This is for investors who are comfortable with more risk and like to keep an eye on the market. You buy more when the market drops significantly. This could mean bigger returns, but it takes more research, timing, and self-control.
Example:
Let’s say the overall stock market (like the S&P 500) has been doing well. Suddenly, something happens (like worries about the economy), and the market drops 10%.
In this case, you’d research why the market dropped. If you think the reasons are temporary, you might invest more money than usual, taking advantage of the lower prices.
If you normally invest $500 a month – during this dip, you invest $1,000.
What Should I Invest In?
Now let’s get started and choose between 3 choices: index funds, ETFs and individual stocks.
There are three big indexes you’ll hear about:
Indexes
- S&P 500: The 500 top companies in the U.S. It’s a good overall view of the market.
- Nasdaq 100: The top 100 non-financial companies listed on the Nasdaq exchange. It’s heavily weighted towards tech companies.
- Dow Jones Industrial Average: This tracks 30 large, publicly owned companies based in the U.S.
Choice #1: Invest in Index ETFs (Steady and Least Risky)
We can’t directly buy an “index,” so investment companies created ETFs (Exchange Traded Funds) that mirror these indexes. It’s like buying a slice of the whole pie. You buy shares of the ETF, and its price moves almost exactly like the index it tracks.
Let’s look at a couple of examples:
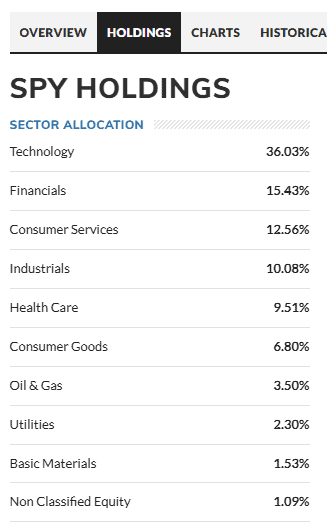
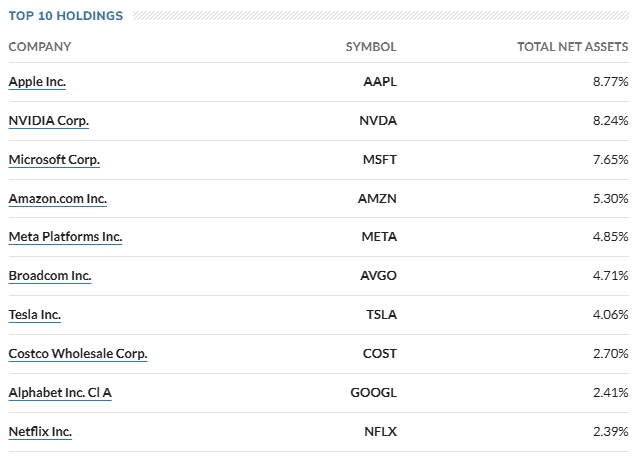
- SPY (S&P 500 ETF): This ETF tracks the S&P 500. It’s a diversified fund, with 36% of its holdings in technology companies.
And within that, a large portion (around 7% at the time of writing) is in Apple. So, how Apple performs has a strong impact on the SPY performance.
Note: There are many alternative index-fund ETF’s that are almost identical to the SPY, such as VOO. We will review alternative ETF’s in future posts.
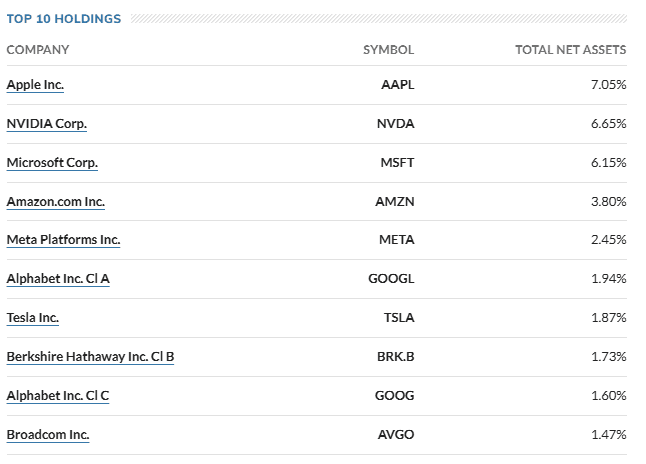
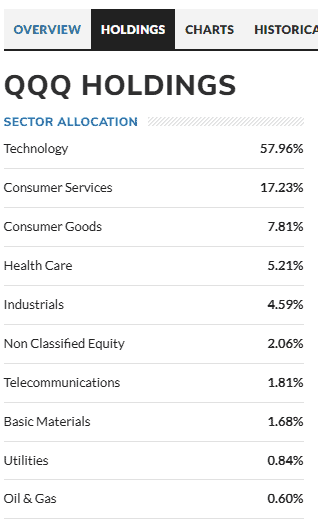
- QQQ (Nasdaq 100 ETF): This ETF tracks the Nasdaq 100. It’s even more focused on tech, with almost 58% of its holdings in technology companies.
Apple also has a big influence here, around 8.77%. If there’s a downturn in the tech sector, QQQ will likely be more affected than SPY.
Choosing Between SPY and QQQ (or similar ETFs):
If you really believe in technology companies, one may consider the QQQ. But remember, that also means you’re taking on more risk if the tech sector underperforms. There’s no right or wrong answer—it depends on your risk tolerance and what you believe in.
For beginners, it’s generally best to start with index ETF’s (such as S&P 500 or Nasdaq 100) that follow the overall market.
There are also mutual funds and ETFs that track specific sectors like healthcare or fintech, but we won’t focus on those right now. We’ll cover them in more detail in future articles.
Choice #2: Hybrid Approach (Balanced)
The “hybrid” approach is about balancing your investments to reduce big losses. It’s for people who like the stability of index funds but also want to invest in individual companies they believe in.
Here’s how it works:
Split your investment: Instead of putting all your money into one stock, you divide it between an index fund and a few individual stocks.
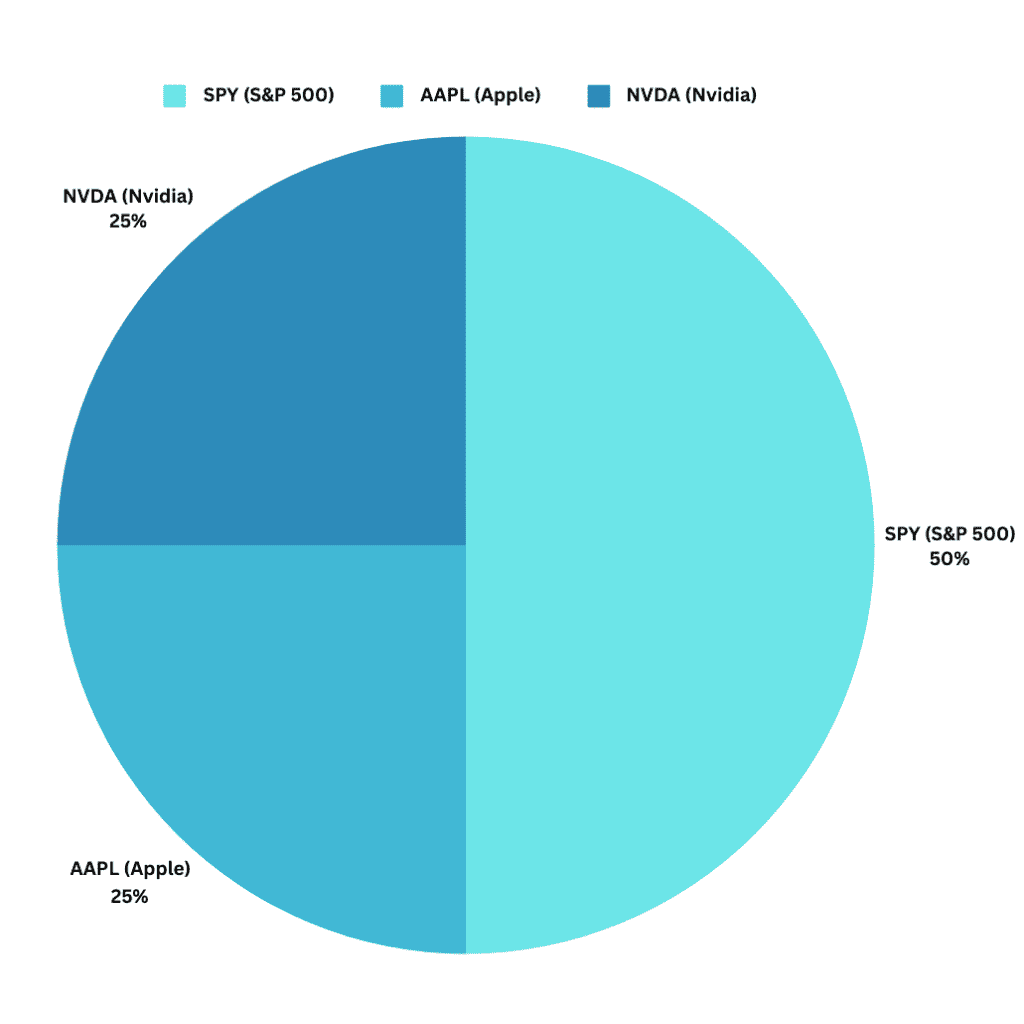
Example:
- You have $500 to invest this month.
- Put 50% ($250) into an index fund (like SPY, QQQ, VOO, etc.)
- Split the other 50% ($250) between 1-2 individual stocks, for this example, let’s use Apple and Nvidia ($125 each).
This way, if one of your individual stocks does poorly in the short term, your diversified index fund helps cushion the blow.
Because the index funds invests in hundreds of companies, it helps reduce the impact of any single company’s poor performance. This helps protect your overall investment from big short-term losses.
Choice #3: Invest in Individual Stocks (High Reward, High Risk)
Finally, let’s talk about investing in individual stocks. If you know what you’re doing, this can be really rewarding—just look at companies like Tesla for example. But it’s also the riskiest way to invest, especially if you’re a beginner.
The most important thing with individual stocks is research. If you don’t understand a company’s finances and what its future looks like, you’re basically gambling.
Here’s why:
- You’re putting all your eggs in a few baskets: If you only invest in a few stocks, and one of them does poorly, it can really hurt your overall investment.
- Emotions can take over: When you’re heavily invested in just a few companies, it’s easy to get emotional when the market goes up or down. If a stock drops, you might panic and sell, even if it’s just a short-term dip.
It’s usually better to start with a more diversified approach, like investing in index funds, and then start picking individual stocks later as you learn more.
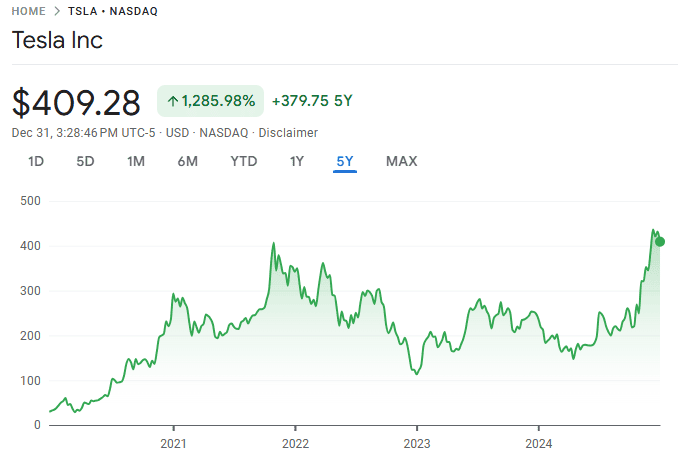
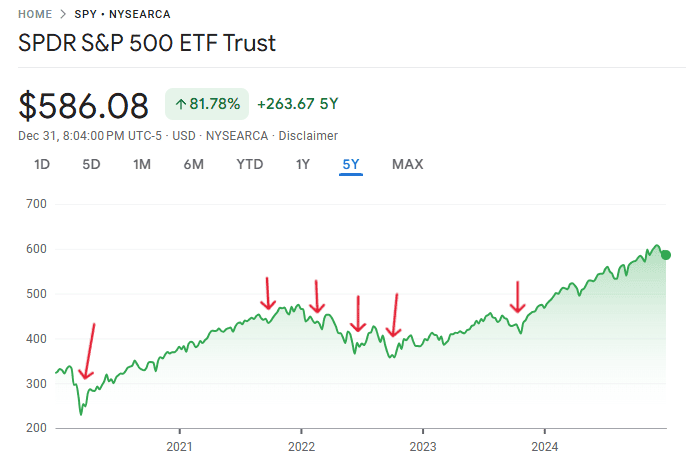
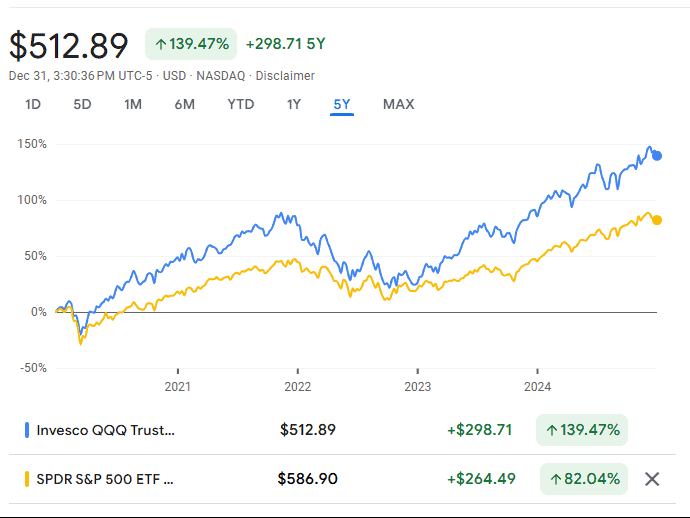
Looking at the chart above, let’s say you were really confident in Tesla’s future five years ago.
If you had invested $1,000 then (without adding a single dollar) and just let it sit, it would be worth $12,860 today! That’s a 1,286% return!
And what if you had invested $10,000? Your investment would be worth $128,600!
While the idea of big gains is tempting, sticking to just a few individual stocks is generally not a good idea for most beginners.
It can be risky because of the lack of research most beginners do, the lack of diversification, and the tendency to make emotional decisions.
Take Action & Start Today
An important part of building a strong financial future is retirement planning, and the earlier you start, the better.
Time is your greatest asset when it comes to investing. Set it and forget it. Thanks to the magic of compounding, even small amounts invested consistently over many years can grow into a substantial nest egg. Starting early gives your money more time to work for you.
Think of it like this: if you start saving for retirement in your 20s, your money has decades to grow and benefit from compounding.
If you wait until your 40s or 50s, you’ll need to save significantly more each month to catch up.
Starting early gives you a huge advantage!
Final Thoughts
We all want a secure future for ourselves and our loved ones. That’s why prioritizing your finances is so important. You don’t want to be regretful later on.
Taking even small steps today is an investment in your future self that will pay you for years to come—and it’s easier than you think to get started!
Remember, it’s about taking those first steps and learning along the way. You don’t need to be a Wall Street expert to make smart choices with your hard earned money.
As you start your journey, keep a few key things in mind:
- Watch those fees: Management fees can eat into your returns over time, so always compare fees between different funds and brokerages. Even small differences can make a big impact in the long run.
- You’re in the driver’s seat (with IRAs): One of the great things about Roth and traditional IRAs is the flexibility they offer. You have the freedom to choose how and where you want to invest. This control lets you tailor your investments to your specific needs.
Building a secure financial future takes time and effort, but it’s absolutely worth it!
By understanding the basics of stock picking and making informed decisions, you can take control of your retirement savings and work towards achieving your financial dreams.
Don’t be afraid to start small, do your research, and learn from your experiences. The most important thing is to take action today.
Let me know your thoughts below. What is your plan moving forward?
👉 Follow me on Pinterest for more tips on wealth, money and business!
More Reading About Personal Finance
My Favorite Tools
To help you reach your money goals, below are resources you can use to get started. Most are free to sign up and will support your money goals.
- Check your credit for free with Credit Karma
- Get 3 or 20 free shares with the Webull app
- Get $30 cash back when you start shopping online with Rakuten

Leave a Reply